Begin by naming the frozen material
“Arctic ice” is not a single substance with one history. Sea ice forms when seawater freezes. Glacier ice develops from accumulated snow that becomes compacted over time. Permafrost is ground that remains at or below freezing for at least two consecutive years; it may contain substantial ice, but it is not simply another name for an underground glacier. These distinctions determine what a scientist can measure and what a visitor might reasonably infer.
In Svalbard, a traveller may encounter glacier fronts, seasonal snow and floating ice during the same journey. In Greenland, a coastal iceberg may have calved from a glacier connected to the ice sheet. Similar-looking scenes can therefore represent very different processes. Ask your guide about the setting before attaching a climate story to a photograph. When identification is uncertain, record that uncertainty rather than replacing it with a confident label.
A frozen archive is not an open book
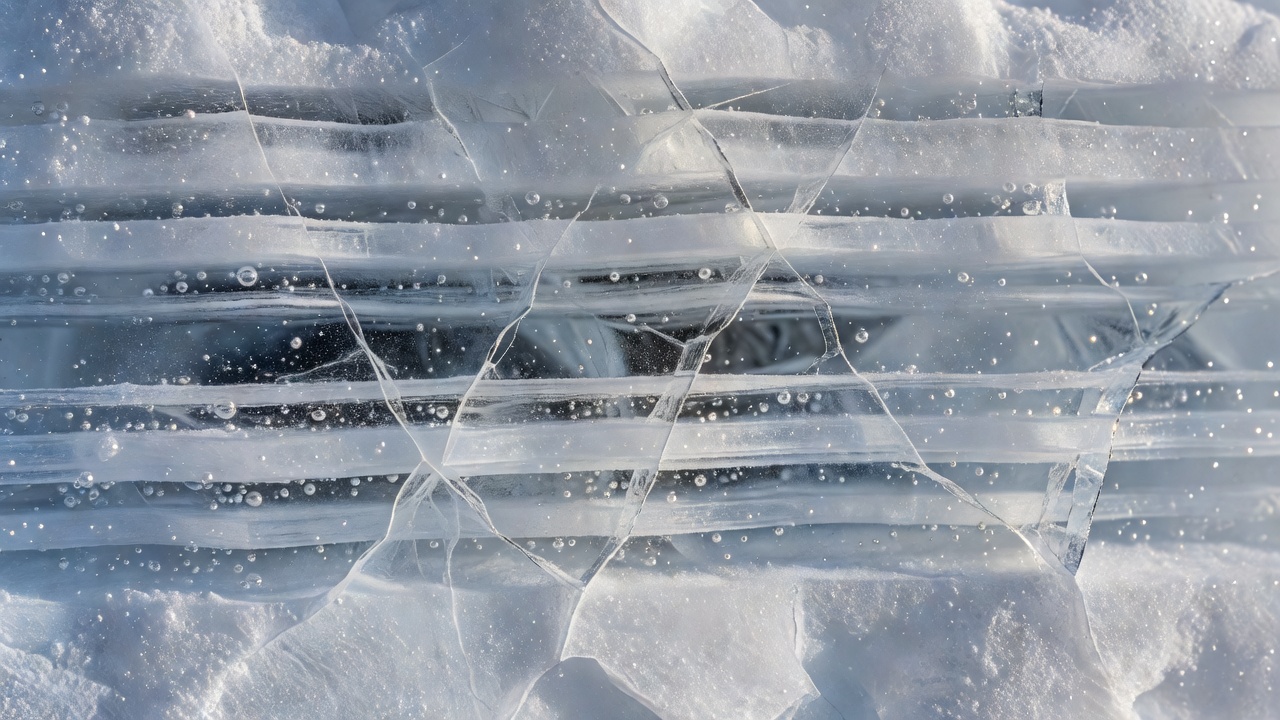
Ice cores can preserve information about past environments. Researchers examine properties such as stable isotopes, dust and gases trapped in bubbles, using carefully developed dating and analytical methods. Different measurements represent different parts of the climate system. Even the age of trapped air can differ from the age of the surrounding ice because bubbles close off after snow has been deposited.
The Greenland Ice Core Project, commonly called GRIP, and the North Greenland Eemian Ice Drilling project, NEEM, illustrate the scale of collaboration behind these records. Their findings are not obtained simply by noticing visible stripes. Sample selection, contamination control, instrument calibration and comparison with other records are essential. A museum display or public lecture can introduce this work without giving visitors any reason to touch, collect or remove ice from a research site.
Sea ice asks a different set of questions
For sea ice, scientists distinguish extent, concentration, thickness, age and movement. The National Snow and Ice Data Center explains that sea-ice extent is calculated using a defined concentration threshold. It is not the same as the total area of solid ice, and it says nothing on its own about thickness. A vessel passing through open water therefore cannot establish the condition of the entire Arctic Ocean.
Season also matters. A summer visit and a spring expedition observe different stages in the annual cycle. Wind can redistribute ice; currents move it; surface melt can complicate interpretation. Satellite observations help place local conditions in a broader frame, while field measurements answer questions that satellites cannot resolve in the same way. NOAA’s Arctic Report Card brings several kinds of evidence together rather than relying on a single dramatic scene.
Look for context, not a souvenir sample
A glacier front is dynamic and potentially hazardous. Calving, unstable slopes, floating ice and sudden waves are reasons to respect the operator’s distance and landing decisions. Never approach a face or enter an ice cave because a photograph makes it appear accessible. Apparent stillness is not an assessment of stability, and an educational interest does not reduce physical risk.
You can practise useful observation from an authorised route. Describe whether the surface appears wet or dry, whether sediment is visible, and what the weather was during your visit. Avoid inventing dimensions from an unscaled image. Do not chip off a fragment for inspection: collection may be prohibited, unsafe or damaging, and an isolated sample without provenance usually tells you much less than expected.
Separate a snapshot from a trend
A single visit establishes that you saw a particular scene at a particular time. A trend requires a comparable series, and explaining its causes requires more evidence still. Two glacier photographs may differ because of viewpoint, snow cover, season or actual change. The appropriate response is not to dismiss photographs, but to ask how they were made comparable and what independent measurements support the interpretation.
Before travelling, explore resources from the Norwegian Polar Institute, the Danish Polar Portal and the National Snow and Ice Data Center. Afterward, return to your notes and label each entry as an observation, an interpretation or an unanswered question. This simple practice makes uncertainty visible. It also turns an impressive landscape into a sustained learning experience without claiming that your holiday has produced a scientific result.
Notebook exercise: make two separate statements
Observation: “Several dark bands were visible from the authorised viewpoint.” Question: “Could sediment, melt processes or layering explain them?” Do not convert the second statement into an answer without evidence.